System presentation
System presentation
Detection module
 To
To 
Oil slicks must be separated from other ocean features giving similar signatures in the SAR image, so-called look-alikes. Our automatic image analysis algorithm does this by considering:
- Wind. With no wind, an oil slick will be completely invisible. At low wind speeds (3-4 m/s), oil will normally be visible. However, look-alikes are frequent under such conditions. Only heavy oil is visible under high wind speed (7-10 m/s). Very thick oil may be visible at even higher wind speeds.
- Shape. Oil slicks are often more regular and smooth in shape than look-alikes (more "fractal" like). The slick may be more irregular with time.
- Backscatter level. There may be a large difference between the mean backscatter level within an oil slick and the surrounding area. However, this difference is dependent of the wind speed.
- Border. There is often a steep backscatter gradient along the border of an oil slick, however, wind conditions may smooth this gradient.
The three main parts of the Detection Module are:
Dark spot detection
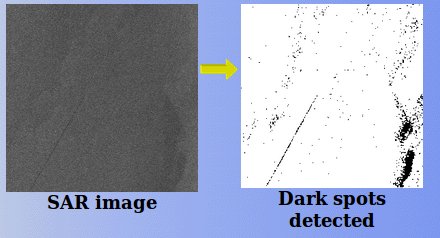
The dark spot detection is based on a modified adaptive thresholding algorithm. The local backscatter value is calculated within a moving window. The threshold is calculated from the difference between the local backscatter value and an expected dampening effect from oil. The dampening effect has to be calibrated from a training set also used to establish the initial statistical slick model used in the classifier. The resulting dark spots are then postprocessed to remove pixels that are less likely to be part of an oil slick (intermediate backscatter values). A computer model, a slick model object, are generated for each dark spot that was determined by this algorithm. The model constitutes a mask defining the spot area in the image and a feature vector describing the properties of the spot.
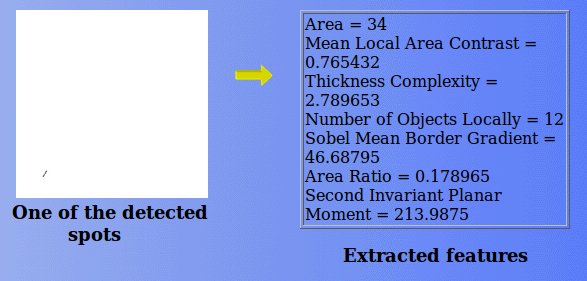
Feature extraction
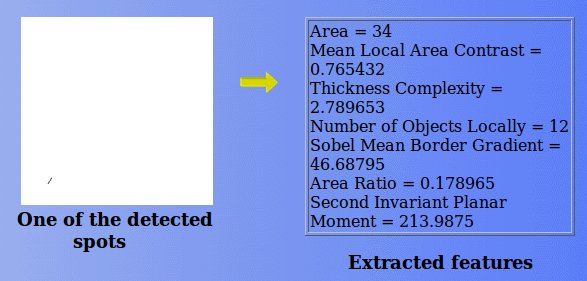
Each feature or descriptor in the feature vector of the slick model has a corresponding feature extraction algorithm. Most features are related to physical features. There is a total of 15 features that have been found to be useful, however, when the system is trained, a subset of these features are extracted and used in the statistical slick model. The features are shown in the table below.
| # | Name | Description |
| 1 | Area | Number of pixels |
| 2 | Inverse Skeleton Proportion | Ratio of the area of the skeleton to the whole area of the region (Lee 1992) |
| 3 | Thickness Complexity | Inverse Skeleton Proportion ¥ ratio of the perimeter to the area |
| 4 | Grey Level Mean | Average backscatter value |
| 5 | Grey Level Standard Deviation | Standard deviation of the backscatter values |
| 6 | Homogeneity | Ratio of standard deviation to mean for areas surrounding the slick |
| 7 | Number of Objects Locally | Number of nearest objects |
| 8 | Number of Objects Globally | Total number of objects in the image |
| 9 | Mean Local Area Contrast | Ratio of Grey Level Mean to mean back scatter level of the surrounding area |
| 10 | Sobel Mean Border Gradient | Mean value of the magnitude of the gradient of the border |
| 11 | Smoothness Contrast Locally | Ratio of mean gradient outside the area locally to the same measure inside the area |
| 12 | Area Ratio | Ratio of border length to the area |
| 13 | First Invariant Planar Moment | Derived from first second and third order central moments (Bell 1965, Hu 1962) |
| 14 | Second Invariant Planar Moment | Derived from first second and third order central moments (Bell 1965, Hu 1962) |
| 15 | Ship Distance | The distance to the nearest detectable ship. |
Classification
Each of the slick model objects are classified based on the object's feature vector and the wind category (estimated from the mean backscatter level of the image) using a statistical slick model. There is one statistical slick model for each wind category. The appropriate model is used to calculate the conditional probability density for the object being an oil slick or a look-alike. The probability density is computed based on the Student's t distribution. The posterior probability for the two classes is then computed from the conditional probability density and the prior probability for oil slicks. The prior probability for oil slicks is modelled as a function of the wind category, the complexity of the image, the size and shape of the slick, and its surroundings. A loss function taking into account the expected number of oil slicks versus look-alikes is used when assigning each object to the class which minimizes the expected loss.
Verification
Verification is normally activated by the user when an alarm is triggered by the Detection Module. It can also be started without relying on the Detection Module in order to do manual screening of incoming SAR images. Verification provides the functionality needed by an operator in the detailed analysis of potential oil slicks.
The main graphical user interface component of Verification is the viewer in which map data and the SAR image are displayed. Initially, the SAR image is displayed together with the oil slick masks and the land mask. The land mask may help the user to inspect slicks near the land more thoroughly since look-alikes are frequent along the coastline. The user may also display other layers on top of these: a territorial border map, a potential spill source map and wind and sea current data. The territorial borders map helps the user to distinguish between slicks within national, foreign and international territories. When it is difficult to determine from the SAR image alone whether some spot is an oil slick or not, the potential spill source map may be useful. An oil refinery near the spot is an indication of a high probability of this spot being a real oil slick. The wind and sea current data are of help in interpreting the SAR image.
A set of image enhancement functions are available in order to enable the user to clearly visualize all information present in the image that may be needed to verify an oil slick. There are also functions for extracting information from the image and for doing geographical measurements. The user may edit the slick masks received from the Detection Module defining the oil area in order to obtain more precise masks, if required.
Finally, Verification permits the user to enter his decision and a comment into the database. The result is fed back to the Detection Module in order to update the statistical slick model. In this way the system learns from experience.

The Verification viewer with menus. The sea is white and land is green. There are two probable oil slicks in the upper left corner of the SAR image.
Asessment mode
he operator would turn over to the Assessment Mode if the alarm was verified and the slick was judged not to be harmless. The Assessment Mode could also be started before a possible aircraft verification in order to determine if resources should be spent on aircraft verification. This mode allows the operator to place the oil slick in correct geographic context. Various map overlays are shown on top of the image, e.g. maps showing fishing areas, sea farms, recreational areas and environmental fragile areas. The operator may also add wind information in order to better determine the possible development of the situation. The module includes oil slick development simulators. There are two simulators. One is based on an empirical relationship between the oil slick, wind and sea currents. The other is a comprehensive physical model. The result of the modelling is a map showing the probable oil slick trajectory in the area covered. If the situation is threatening commercial or environmental resources, the operator may choose to switch to the next mode: Operations
Assessment viewer and two windows. The viewer shows the predicted trajectory of the oil slick the next eight hours. Commercial beaches in blue, natural reserves inside pink polygones, important fishing resources inside yellow polygone. Hence, the oil slick (in red) will probably reach a commercial beach in eight hours. Left window shows information about the SAR image, meteorological data and simulation parameters. Right window is used to enter information in order to generate an alarm report automatically.
Operations mode
The Operations Mode supports a possible cleanup operation. The module includes an equipment database and tools to archive the development of the oil slick. The equipment database is used to determine which resources are available in the region for a cleanup operation and to set up an equipment plan for the operation. If the situation lasts for some time, several SAR images may be acquired from the emergency area. The interpreted SAR images and field data are handled by the module.
Alarm reports may be generated in an automatic way from both Assessment and Operations Modes. They may be sent by fax and/or email to the selected institutions simply by a few mouse-clicks.