Emergency management
Emergency management
An environmental emergency situations has most of the following characteristics:
- Potentially serious to people and environment
It is therefore imperative to take action in order to manage the situation in a way that avoids or minimises the damages. However, up to now no efficient tools for this purpose have been available.
- Sudden appearance and geographically extended
This has until recently made it difficult to efficiently detect and monitor such phenomena. The advent of high spatial resolution satellite remote sensing has made this possible
- Potential of rapid development
Therefore, it is necessary also to monitor the phenomenon frequently. The same remote sensing technology makes this possible. However, to make the remote sensing data useful, fast data transfer is needed as well as automatic or semi-automatic processing because of the huge data amounts.
From this brief description of the situation, one can draw the conclusion that remote sensing is a promising approach, however, additional technology is strictly required in order to be able to use the approach. It is necessary to transfer the data fast from the satellite ground station to the emergency monitoring center. Furthermore, the data amounts may be so huge that automatic or semi-automatic processing of the data is necessary. When the emergency situation is detected, it is necessary to combine a lot of data in order for the operator to be able to draw the right conclusions. Note that several data sources may be distributed, and require rapid transfer of data. What is needed are efficient information technology solutions.
ENVISYS - The solution for management of different emergency situations
ENVISYS has currently been implemented in a prototype for marine oil spill detection. However, ENVISYS also represents a generic approach to environmental emergency management. Therefore, we foresee several application types in the future.
Marine oil spill
The use of Synthetic Aperture Radar (SAR) permits to detect oil pollution on the sea surface day and night and in most weather conditions. The combined use of advanced information technology, GIS, computer science, mathematics and statistics has made it possible to develop the ENVISYS system, which not only performs the detection completely automatically, but also provides efficient tools for manual verification, assessment of the situation and support in the planning of and during a cleanup operation.
 Oil spill as seen in SAR images:
Oil-spill detection by Synthetic Aperture Radar (SAR) is based on the dampening effect oil has on capillary and short ocean surface waves. The microwave backscatter from the ocean surface is reduced in areas where oil is present. The result is that oil slicks turn out as dark areas on a brighter background.
The synthetic aperture radar (SAR) onboard the ERS satellites are the most suitable single instruments for oil spill detection on board present and near-future satellites. This instrument is working on principles quite similar to the SLARs (Side-Looking Airborne Radar) in traditional surveillance aircrafts, producing a greyscale image which represents the radar backscatter from the ocean surface. With a 6 cm wavelength, VV polarisation, and an incidence angle of 23 degrees, the instrument is very sensitive to the presence of short gravity waves on the ocean because of Bragg scattering. Such waves are dampened by oil slicks. Thus, oil slicks can be seen as dark spots in ERS SAR images.
For oil spill detection, low-resolution (LRI) SAR images with a spatial resolution of 100 m * 100 m have been found to be suitable. The oil spill detection capabilities of different radar satellites are as follows:
- ERS-1 and ERS-2: Adequate for oil slick detection at low and moderate winds (2-8 m/s).
- JERS-1 SAR: not suited for oil slicks.
- Radarsat-1 is acceptable for oil spill when operating in Narrow-ScanSAR-Near-Range mode. The first images from Radarsat show a much better performance regarding oil spill detection capabilities than expected due to a better signal-to-noise ratio.
- ENVISAT: The ASAR Wide Swath mode seems to be good for oil spill monitoring.
Satellite coverage:
The radar satellites are in polar orbits. The coverage, or the number of passes per day, thus depends on the latitude. The coverage is good close to the poles and decreases with the distance to the poles. The coverage is twice as good in the Norwegian Sea (65° N) as in the Mediterranean (35° N). The ERS satellites have a swath width of 100 km. This means that while the average number of satellite passes per day will be 0.09 in the Norwegian Sea, the corresponding number for the Mediterranean will be 0.04. Radarsat can detect oil spills when operating in Narrow-ScanSAR-Near-Range mode (swath width 300 km). When operating in this mode, a maximum number of 0.54 satellite passes per day in the Norwegian Sea and 0.27 passes per day in the Mediterranean can be acquired. The planned ENVISAT satellite (scheduled for launch in 1999) will be able to operate in Wide Swath mode (swath width 400 km), resulting in 0.72 satellite passes per day in the Norwegian Sea and 0.36 passes per day in the Mediterranean.
The limited satellite coverage must be viewed in light of the lifetime of the oil slicks. Small slicks might be dissolved in hours, but larger slicks will have a lifetime of several days. ENVISAT is thus very promising in term of detecting and giving an early warning of oil slicks of a certain size. The development of the detected spill must be monitored using additional sensors.
Slick visibility:
The SAR can operate well with cloud coverage. However, there are some limitations regarding weather conditions in identifying oil slicks. At high winds, the oil may be washed down into the sea, and no surface effect is observed in the SAR image. At very low winds, no SAR signal is received from the sea, thus, no slicks can be seen. ERS-1 SAR imaging of oil spills can be characterised as follows:
- 0 m/s: No backscatter from the undisturbed sea surface, hence no signature of oil slicks.
- 3 m/s: Excellent perturbation of the slightly roughened sea surface, no impact from the wind on the oil slick. A high probability of oil slick look-alikes due to local wind variations.
- 3 to 7-10 m/s: Better conditions relative to false alarms from local low-wind areas. The oil slick will still be visible and the background more homogeneous.
- > 7-10 m/s: Only thick oil will be visible. Thinner slicks will be invisible due to combination of oil slick dispersion. The maximum wind strength for slick detection is a variable depending on oil type and slick age. Thick oil can be visible with wind stronger than 10 m/s.
Forest fires
Forest fires may be detected from satellites and from land-based cameras. ENVISYS proposes to automatically retrieve and integrate data from both sources in order to obtain a very reliable surveillance system. Furthermore, ENVISYS will not wait passively until a fire occurs, but will, based on remote sensing and meteorological data, give an early warning by providing maps showing the risk of forest fires. Other features of the system are tools for the assessment of the situation, support to the fire combat action and a post-assessment of the fire consequences.
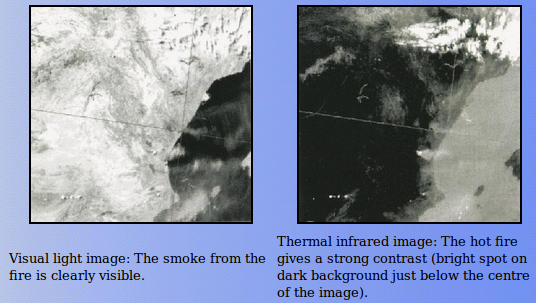
Forest fire detection is based on data from the visible or thermal infrared part of the spectrum. The signature in thermal infrared is easiest to detect. The energy emitted by the fire will create high intensity compared to the surrounding areas. In the visible part of the spectrum, the smoke from the fires is most dominating.
Floods
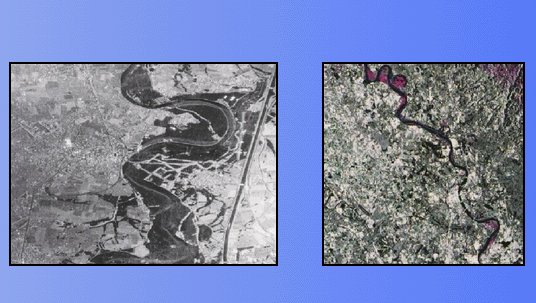
Floods may be detected and monitored by remote sensing by detecting changes of a water-body's border. Early warnings are possible e.g. by remote sensing of snow properties or by meteorological predictions of heavy rainfalls. Remote sensing also allows the evaluation of the extent of damages to roads, buildings and other constructions, agricultural areas, forests and the environment. ENVISYS proposes a system that integrates these functions and tools for support to counter-actions.
Earthquakes
Remote sensing allows measuring changes of the terrain surface shape down to the centimetre level. Hence, it can be used to detect small earth crust movements that may be an early warning of an earthquake. In addition, the damages caused by an earthquake may be determined using remote sensing data. ENVISYS proposes an integrated system with these two features and fully automatic retrieval of data.
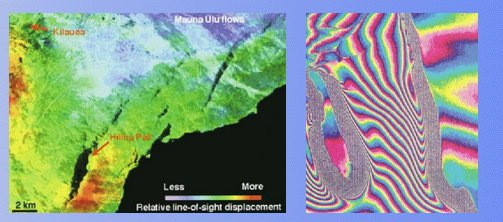
SAR interferometry measures the phase difference between two images, corresponding to the change in the round-trip path length of the radar waves to the same ground point. The right image shows the phase difference between two images. In the left image the colours represent the magnitude of the earth crust movement, with areas of largest movements in red.