Status of work
Status of work
Climate model
Albedo can be defined as reflected solar radiation at earths surface divided by the total incoming solar radiation. The albedo is therefore an important parameter in the energy balance at the surface. The albedo depends heavily on the surface characteristics (e. g. snow, ice, soil moisture, vegetation), and a proper representation of this is an important issue in atmospheric models. The parameterization used in models varies from simple schemes (constant albedo) to more complex schemes which try to handle how details as snow on canopy and snow structure influence the albedo. The most common parameterisation of snow albedo is based on a dependency between the albedo and snow temperature.
However, also these relatively simple schemes diverge. The two figures show mean albedo (in red) simulated in a numerical atmosphere model for 16 days in mid March 2002, were snow was present in larger part of Scandinavia. Also shown in dashed blue is the observed albedo from satellite (MODIS). Both simulated albedo fields are based on a linear temperature dependency, but with different sets of maximum and minimum albedo. One is significantly lower than observed values, while the other is in good agreement at low altitudes but shows a high albedo in the mountains. One aim in the Euroclim project is to develop new and improved parameterisation of albedo over snow and ice covered surfaces.
Glacier monitoring on Svalbard using synthetic aperture radar (SAR) satellite imagery
Glaciers serve as a good indicator for a change in climate conditions, eventually reacting with retreat or advance. Many glaciers have therefore been studied by yearly field surveys. While field measurements still will be necessary, the use of satellite images allows extrapolating these over much larger areas. In addition, we now are able to observe large and remote areas from space, which are hard or impossible to study in the field.
One of the principle aims in using satellite imagery for glacier studies is the identification of various surface types on the glacier surface and to monitor their extent and variations of several years. Changes in the mass balance of a particular glacier will result in changes in extent of those surface types. We are using synthetic aperture radar (SAR) images from ESA's ERS satellites for our studies. In contrast to optical images, the radar signal in the microwave region (5.3 GHz) allows observations during cloudcover and night-time conditions. It is also unaffected by the dry winter snow cover, detecting the end-of-summer surface during the entire winter.
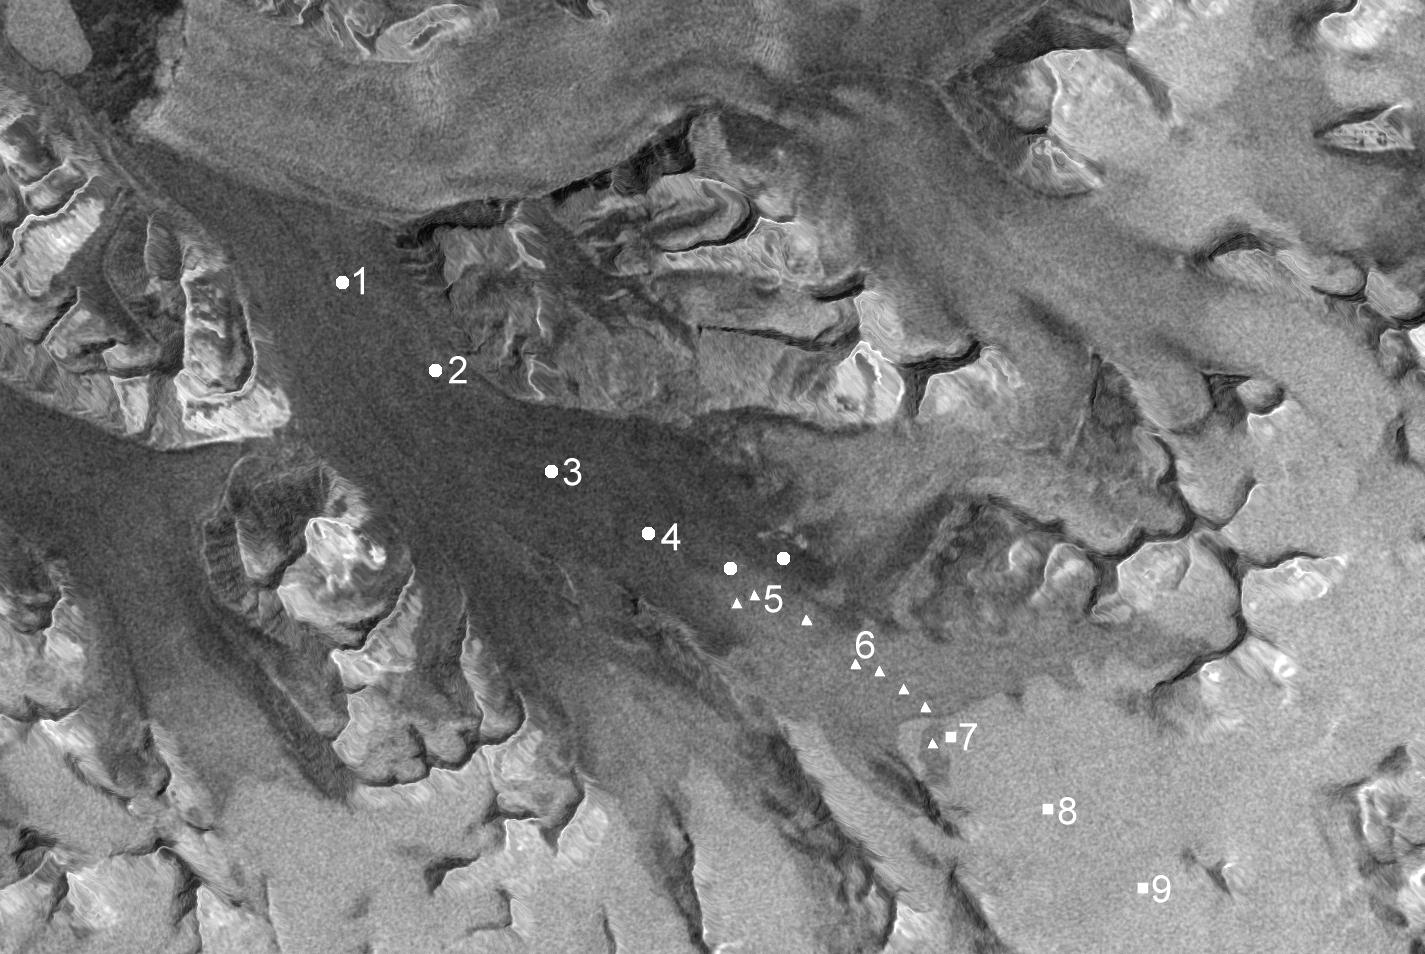
We have studied the glaciers in the Kongsfjorden area using SAR imagery, mainly Kongsvegen glacier (Figure 1). On the glacier, we drilled shallow ice cores (<50cm) in April 1999 and 2000 at the locations marked in Figure 1. All of our SAR images from 1992 to 2002 show three distinct zones on the glacier surface. It has long been an open question as to what SAR exactly is detecting on a glacier surface (König et al. 2001). From earlier studies we could expect that the area with high backscatter corresponds to firn, while the area with low backscatter corresponds to glacier ice (Engeset et al. 2002). The nature of the medium backscatter area, however, is not obvious at first. We compared our ice core results with the SAR images and found a very clear correlation: The area with high backscatter corresponds to firn, the area with low backscatter corresponds to glacier ice and the area with medium backscatter corresponds to superimposed ice. While glacier ice is created by the metamorphism of firn to ice deep in the glacier, superimposed ice is water that has refrozen on the glacier surface. Until now, superimposed ice has not been observed on SAR images elsewhere. The question arises why SAR is detecting superimposed ice on Kongsvegen. Figure 2 shows photographs of ice cores from each surface type. The crystals in the firn core will reflect much of the incoming SAR signal back to the sensor, resulting in a high SAR backscatter. Glacier ice is very clear, having few reflectors, thus resulting in low backscatter. The superimposed ice core has layers with very large air bubbles or many small air bubbles. We believe that it is the differing air bubble content in superimposed ice that causes a higher backscatter compared to glacier ice. More details on this can be found in König et al. (2002).
 In order to determine mass balance from space it would be necessary to distinguish the snow from the present year from the older firn, as well as superimposed ice from the present year from older superimposed ice. Our analysis shows that this is not possible, since recent snow and old firn are indistinguishable on SAR, just as new and old superimposed ice. This means that SAR images cannot give a yearly mass balance value or an equilibrium line altitude the way field measurements do. However, changes in mass balance will cause changes in the overall extent of the mentioned surface areas. Our main goal is therefore to observe the variations of these surface zones on the SAR image and to correlate them to mass balance.
In conclusion, we were able to show that SAR is able to distinguish glacier ice, superimposed ice and firn on Kongsvegen. The equilibrium line itself cannot be observed. Our objective is to extend our analysis over much larger areas in Svalbard, using SAR images from 1992 until today. We then will analyse any changes and trends and correlate these to glacier mass balance data. If successful, we will establish a satellite glacier monitoring system for Svalbard.
References
Engeset, R. V., Kohler, J., Melvold, K., Lundén, B. 2002: Change detection and monitoring of glacier mass balance and facies using ERS SAR winter images over Svalbard. Int. J. Rem. Sens. 23, 2023-2050. König, M., Winther, J-G., Isaksson, E. 2001: Measuring Snow and Glacier Ice Properties from Satellite. Rev. Geophys. 39,(1) ,1-27.König, M., Wadham, J., Winther, J-G., Kohler, J., Nuttall, A-M. 2002: Detection of superimposed ice on the glaciers Kongsvegen and midre Lovénbreen, Svalbard, using SAR satellite imagery. Ann. Glaciol. 34, 335-342.
Authors:
Max König
Snow
Snow cover can be monitored using the optical AVHRR sensor flying on the NOAA polar satellites. A limitation of this instrument is that clouds block the view of the underlying surface, and cloud free conditions is therefor a requirement for this sensor.
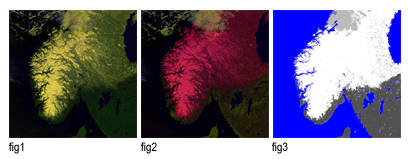 The challenge when monitoring snow cover from the AVHRR sensor is to distinguish between clouds, snow and snow free land. Figure 1 shows a situation over southern Norway from 15.03.2002. It is a false colour image where channel 1, 2 and 4 have been combined. Snow (white) and land (green) can be fairly good separated, but clouds and snow have the same white signature. In figure 2 channel 2, 3A and 4 have been combined. The clouds (grey) and snow (red) are now much more easy to separate, and snow and land (green) can also be separated. In figure 3 a classification algorithm has been applied to the data. Snow can be seen in white, clouds in light grey and snow free land in dark grey.