Some results
Some results
Flood in Trøndelag
.png)
Radarsat-2 backscatter images acquired on August 20, 2011 (top), March 23, 2012 (no. 2 from top), "difference" between the two latter shown as a colour composition (no. 3 from top), and the same area shown in a high-resolution optical image available in Google Earth.
Stjørdalselva ("Stjørdal River") - which flows roughly west across the Norwegian region of Trøndelag in the central part of Norway - flooded in March 2012. The Radarsat-2 satellite captured the image no. 2 from top, a Synthetic Aperture Radar (SAR) image with HH polarization, on March 23, 2012. The top image shows the same area seven months earlier, on August 20, 2011. The selected image subset focuses on the region along the river, where the Trondheim airport at Værnes can be seen at the left side of the image.
The red-coloured areas shown in the radar image correspond to locations with a strong backscattering signal (radar reflection) before the flood event, which were dramatically reduced when the corresponding surfaces were flooded. The colour composition with the radar image is generated placing the reference image (August 20, 2011) in the red component, were the image acquired during the flood event (March 23, 2012) is placed in the green and blue channels.
Visual inspection of the data suggests that the flood event in Trøndelag could be detected using the SAR images considered. Note also that red-coloured areas can also be found in other areas in the image. This is more noticeable in mountain areas, where the snow coverage plays a relevant role, and the radar image captures the different backscattering response measured during the summer season (August 2011) and the snow in the mountains still present the time of the flood event (March 2012).
The detection of flooded areas can be more precise if guided by prior information about the known location of the river, and by the use of a digital elevation model to restrict the area of analysis.
Landslides in Nova Friburgo (Brazil)
A series of floods and mudslides took place in January 2011 in several towns the Rio de Janeiro state, Brazil, causing over 900 deaths, and destructing homes of thousands people.
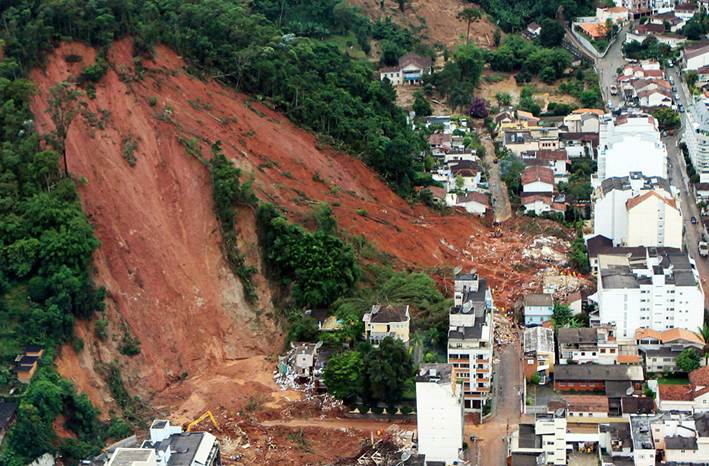
The slope on a hill where a landslide occurred in Nova Friburgo, 130 km north of Rio de Janeiro, Brazil, on January 13, 2011 (Shana Reis/AFP/Getty Images).
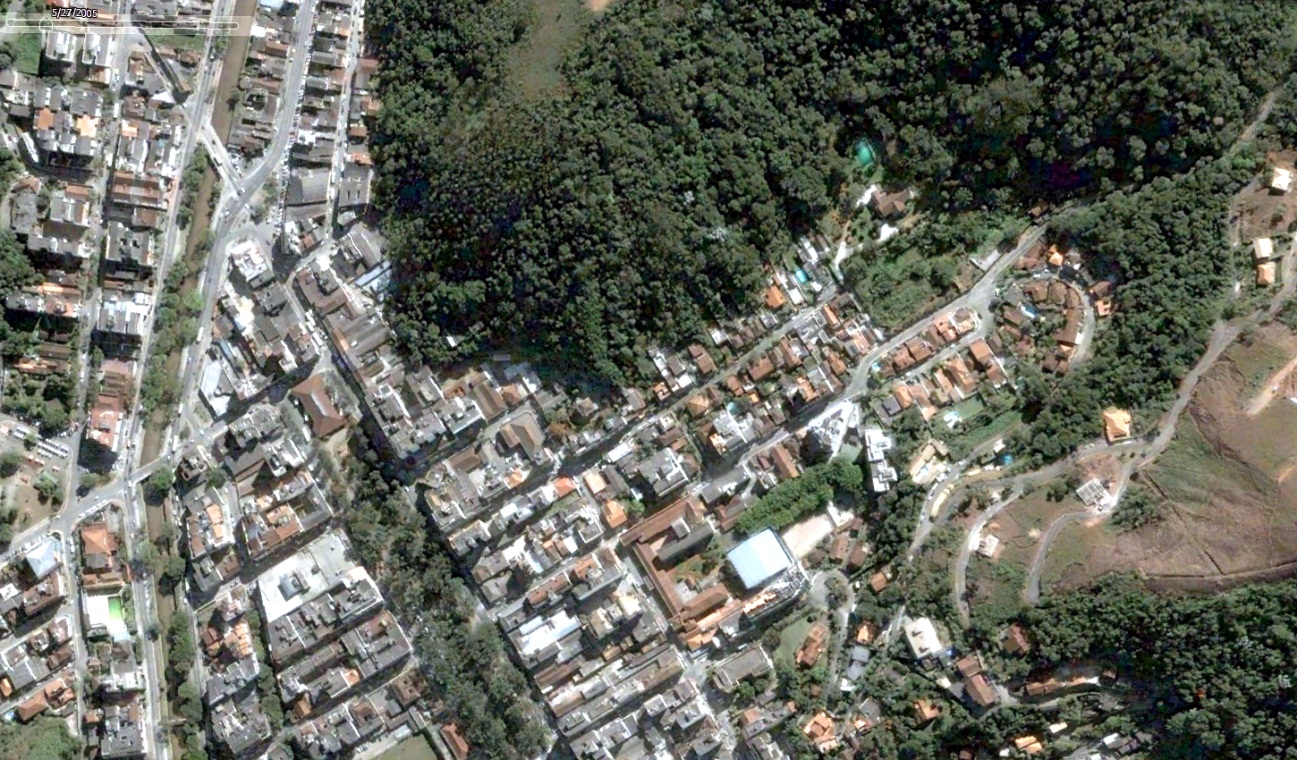
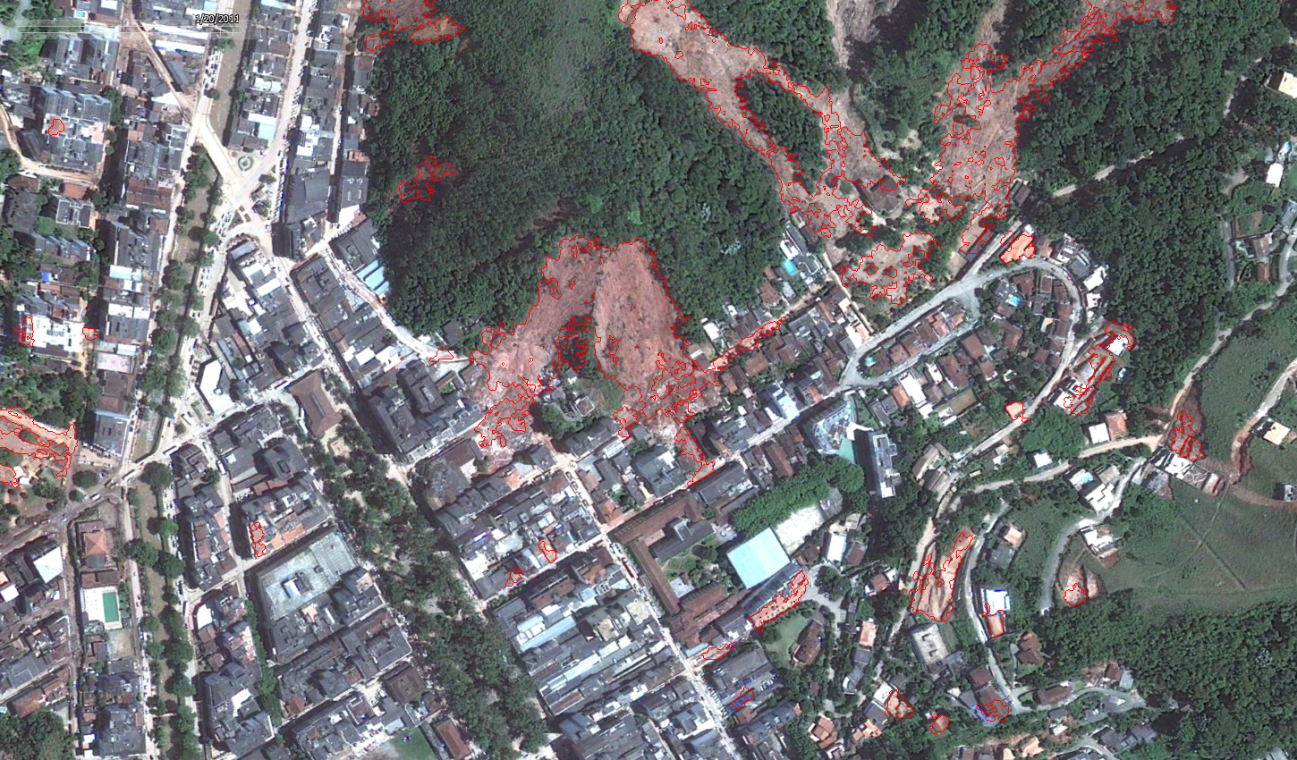
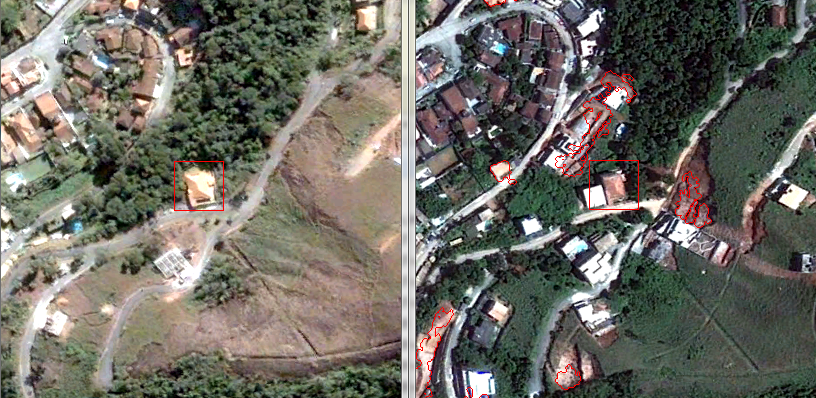
Very-high resolution optical satellite images collected before (May 27, 2005) and shortly after the landslide (January 20, 2011). The red contours overlaid in the second image are examples of landslide areas detected using an automatic method that is currently under development at the Norwegian Computing Center. Source of the images and copyright: Google Earth (2012).
The images above show one of the many landslides affected areas in Nova Friburgo. The top image was acquired in May 27, 2005, the bottom image in January 20, 2011, less than 10 days after the landslide event. Notice that the huge scar shown in the centre of the image above corresponds to the picture of the landslide shown in the previous photo.
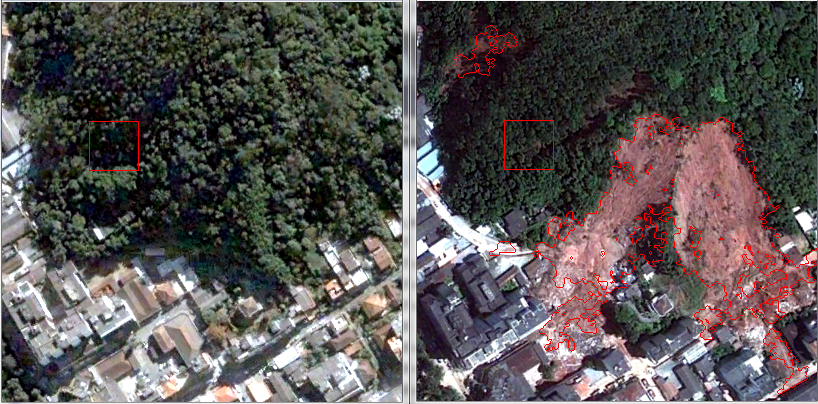
Automatic detection of a huge landslide area. A possible linear change in the middle of the forest, probably due to terrain displacement, was not detected by the current version of the proposed method.
Changes due to urbanization are difficult to separate from landslide related changes (note that several new houses were built between 2005 and 2011 in this particular image subset).
Automated detection of landslides can be done by computing a set of change indicators from the pair of images acquired before and after the event. Examples of relevant indicators are the differences in colours and spatial patterns of the images. When the value of the change indicator for a specific location is high, the area is marked as changed. The complexity of the natural scenes, resolved by very-high resolution optical sensors, makes robust automated detection of changes and mapping of landslides challenging. Differences in the viewing geometry, the presence of cloud and cloud shadows, atmospheric effects, and the accurate co-registration of the images, are among of challenges that need to be addressed during the development of (semi)automatic tools for analysing landslide-affected areas.
In addition to mapping events, we are also interested in investigating how earth observation can help in predicting the likelihood of future occurrences of landslides. EO provides a rich source of information that can be conveniently exploited to estimate atmospheric (e.g. rainfall) and land-controlling factors (e.g. soil type, land cover, topography), which are among the key inputs to statistical/hydrological models.