Main activities
Main activities
Oil spill detection algorithm
The automatic oil spill detection algorithm can be summarized as follows. The details are described further below.
- Preprocessing and calibration.
- Dark spot detection.
- Dark spot feature extraction.
- Dark spot classification.
Preprocessing and calibration
This includes land-masking the images based on a shoreline database, followed by range-dependent scaling and conversion to radar brightness values (beta naught values).
Dark spot detection
All dark spots in the image are detected by a method that takes into consideration the locally varying contrast in the image. A large number of dark spots that are not oil spills will be detected by this step, but the assumption is that they will be removed later.
Dark spot feature extraction
For all the segmented dark spots, features describing shape, contrast, slick surroundings and slick homogeneity are computed.
Dark spot classification
In designing a classifier to discriminate between oil spills and look-alikes, several important factors are considered. One factor is the expected number of oil spills compared to the expected number of look-alikes. The number of look-alikes depends on the wind speed and location. With the given segmentation approach, we sometimes observe several hundreds of look-alikes in a single scene during low-wind conditions. In high wind, only a few look-alikes are expected. The expected number of oil spills does not depend strongly on wind speed. In low wind, even very thin oil films are visible in the SAR image, whereas in high wind, only thicker oil films are visible. The expected number of oil spills in a scene might also depend on the location. Oil spills are commonly seen near oil rigs or major shipping lanes. The classification runs in two steps. First, a statistical classifier is used on a subset of the features. In low wind conditions, this classifier returns a high number of lookalikes as detected oil spills, resulting in a high false alarm rate. In order to reduce this, a number of rules have been developed to eliminate most of the look-alikes. The result of the automatic classification is a list of possible oil slicks, which are then verified by a skilled operator. A pilot installation is currently being evaluated at Kongsberg Satellite Services (KSAT), Troms�, Norway.
Statistical analysis of oil spill data
Kongsberg Satellite Services (KSAT) has through the Marcoast project provided a dataset consisting of 5066 oil slick candidates from 4022 SAR scenes from their operational oil spill detection service to EMSA (European Marine Safety Agency) and other clients (Figure 4). The SAR scenes are from an 18 months period. Since the number of SAR scenes for a given location varies greatly across the study area, a plot of the detections will give a biased impression of the oil spill frequency. To estimate the real frequency, a coverage frequency distribution may be used. The intensity map may be used to focus the oil slick monitoring efforts on high intensity waters. However, one should bear in mind that the areas with a low number of SAR scene coverage also have a relatively large uncertainty in the estimated intensity. A mix of intense monitoring of selected areas combined with a full coverage monitoring may be the best approach.
Clean sea report
In the case that no oil spills are detected, a clean sea report is issued for the area and date/time of the SAR image. To accompany the clean sea report, a confidence image is produced, with color codes
- Black: no data or zero wind
- Red: low confidence -- either the wind speed is below the low wind threshold (default 3 m/s) or above the high wind threshold (default 12 m/s). This means that it is difficult to detect oil spills under these wind conditions, so the sea is clean with low confidence.
- Yellow: medium confidence -- The wind is between the low wind threshold and the medium wind threshold (default 7 m/s) . This means that had there been oil spills in these areas, there is a good chance they would have been detected. So, the sea is clean with medium confidence.
- Green: high confidence -- The wind is between the medium wind and the high wind thresholds. This means that had there been oil spills in these ar
- eas, they would have been detected, so the sea is clean with high confidence.
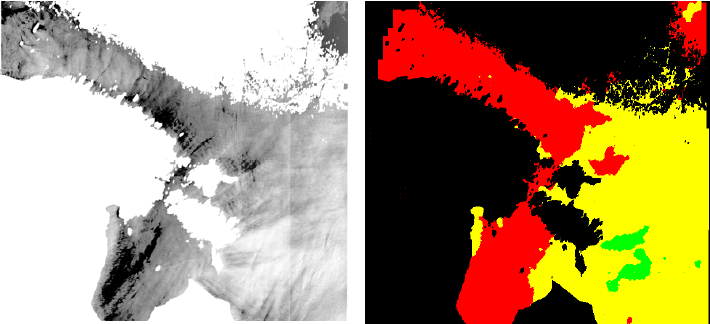
Preprocessed SAR image, in which, most notably, land areas have been masked. Right: Color-coded confidence image for the clean sea report.