Main activities
Main activities
Measurements in situ and by satellites
Two regions were chosen for satellite measurements, one on each side of the large fjord Isfjorden. One is on Grønfjordbreen south of Barentsburg and the other on Eidembreen north of Isfjorden. The distance between the two glaciers is about 60 km. The two regions should have about the same local climate. The snow sites are situated between 300 and 400 m above sea level, and the glacier sites about 150-200 m above sea level (see figure below). With natural conditions without local aerosol sources, one should expect the snow development and therefore reflectance to be quite similar at the two sites. Coal dust concentrations are periodically quite large at Grønfjordbreen, which is less than 20 km away from Barentsburg. This situation enabled more controlled sensitivity studies of a large range of soot and coal dust concentrations. On the other side, Eidembreen should hardly be affected by local sources, and therefore work well as a reference site for the satellite measurements.
For the snow sites, snow samples were collected for material compositional analysis (including black carbon). On-site analysis included spectral measurements, snow characterisation (including grain size and shape) and measurements of snow and air temperatures, wetness, density and depth (as far as a stick could be driven down). Samples and measurements were taken at 4–5 positions at each site in order to achieve an overview of local variability.
For the glacier sites, ice samples were retrieved, scaled images were taken, spectrometer measurements were done and ice cores of about 10 cm length containing cryoconite (granules of mineral particles, organic matter, bacteria and cyanobacteria) were sampled using a drill. The ice was melted and most of the water removed on site.
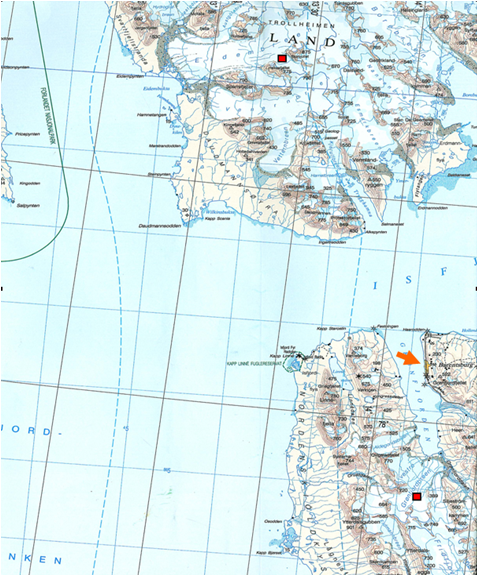
Map of outer part of Isfjorden in Svalbard. The two test sites are marked by red squares. Barentsburg is situated at the eastern side of Grønfjorden, marked with an orange arrow.
Data analysis
At each site an area of 500 m × 500 m were chosen. The Terra MODIS sensor has pixel resolution of 250 m × 250 m in channel 1 (620–670 nm) and channel 2 (841–876 nm). Each of the areas is covered by four MODIS pixels in these channels. Channel 1 has been used for radiance comparison. Envisat MERIS data of 300 m pixel size has been made available to the project through an ESA Category-1 agreement. MERIS channel 6 (620 nm) has been used for comparison with MODIS channel 1.
A technique for analysis of cryoconite particles on the glacier surface in digital field photos was developed for a field campaign at Longyearbreen. Post-processing of photos was carried out in an analysis program developed by NR (see figure below).
The BC samples of snow were stored frozen at UNIS until they were quickly melted in a microwave oven and immediately after filtered through quartz filters. The dried filters were dried and packed for final chemical analysis. The chemical analysis took place at the University of Stockholm with an instrument for thermal/optical carbon aerosol analysis. The analysis result is amount of organic and elemental carbon.
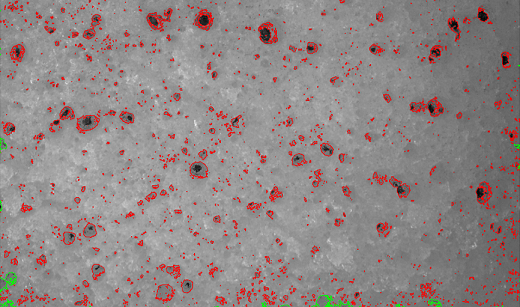
Photo of glacier surface with detected cryconite granules shown by red border lines..